
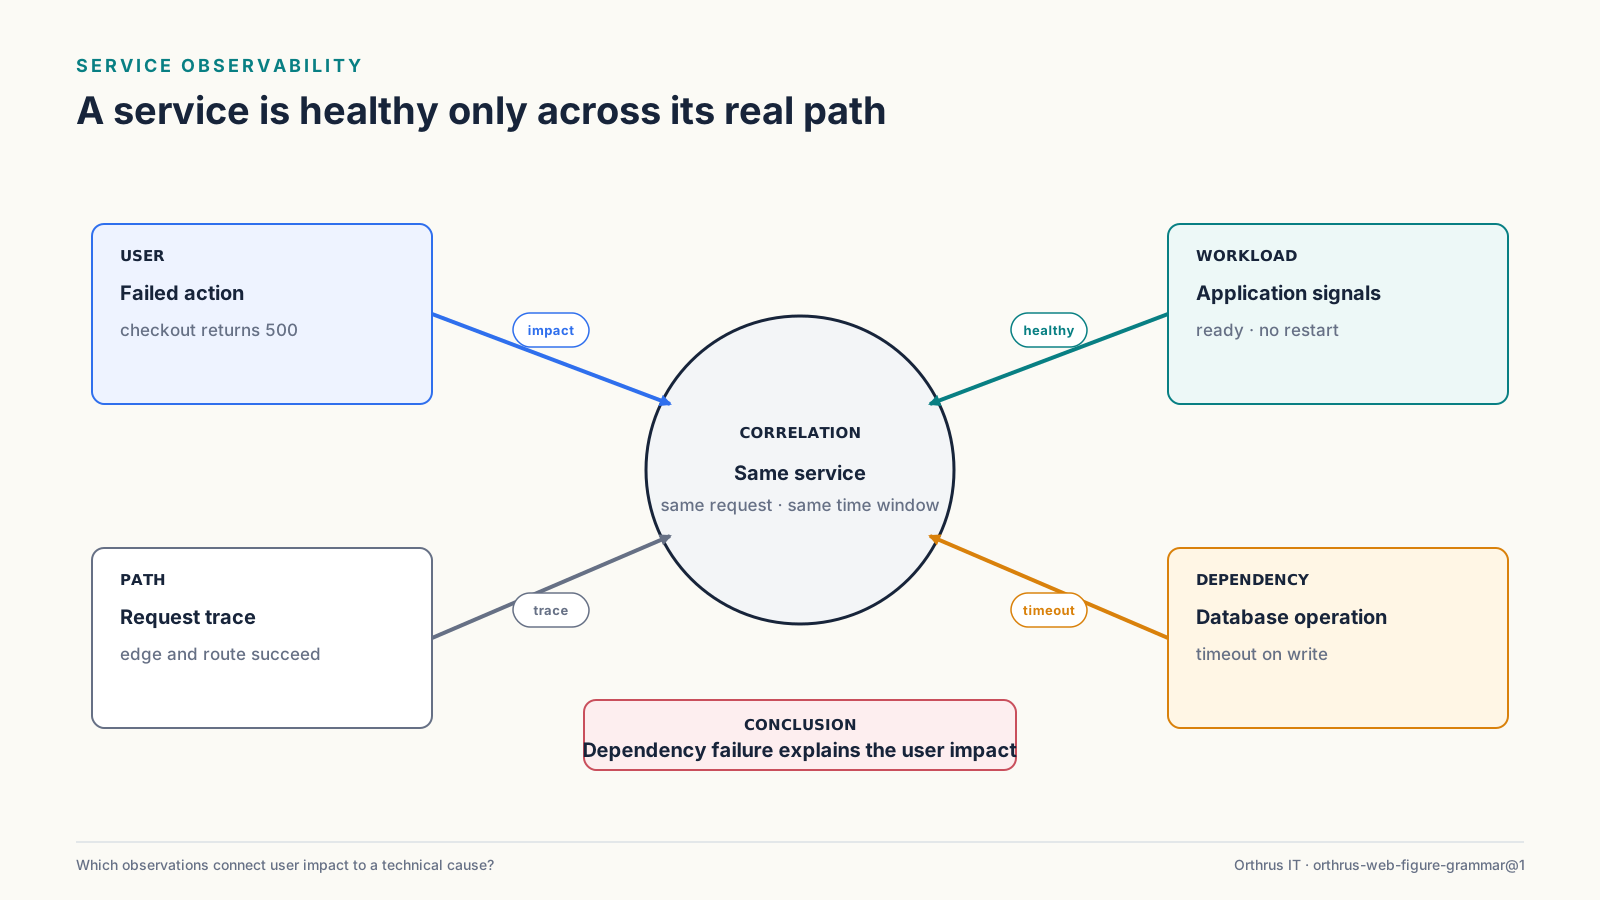
“Is the server up?” used to be a reasonable first question. Containers make it a poor conclusion. A node can be healthy while one workload keeps restarting, and a ready pod can sit behind a broken route or wait forever on an unavailable dependency.
The monitoring model for this platform follows the service across those layers. It collects enough evidence to explain an incident without building a second, oversized platform just to watch the first one.
Start with the workload, then check what it depends on
Workload state shows whether a pod is scheduled, ready, restarting or short of resources. CPU, memory and storage trends add context. Application health checks answer a different question: can the process still perform the work users need?
Dependencies need their own signals. A web process may be alive while its database, storage path or downstream service is unavailable. A useful health model keeps those states separate instead of returning the same reassuring answer for every partial failure.
Centralise logs without collecting everything
Application and operational logs arrive in one searchable place with environment, service and workload labels. An alert can lead directly to the relevant events without a tour of every server and its local files.
More logging is not automatically better. Credentials, personal data and complete request bodies stay out of general operational logs. The aim is enough context to diagnose the fault, without quietly creating another sensitive data store.
Alert only when a decision is needed
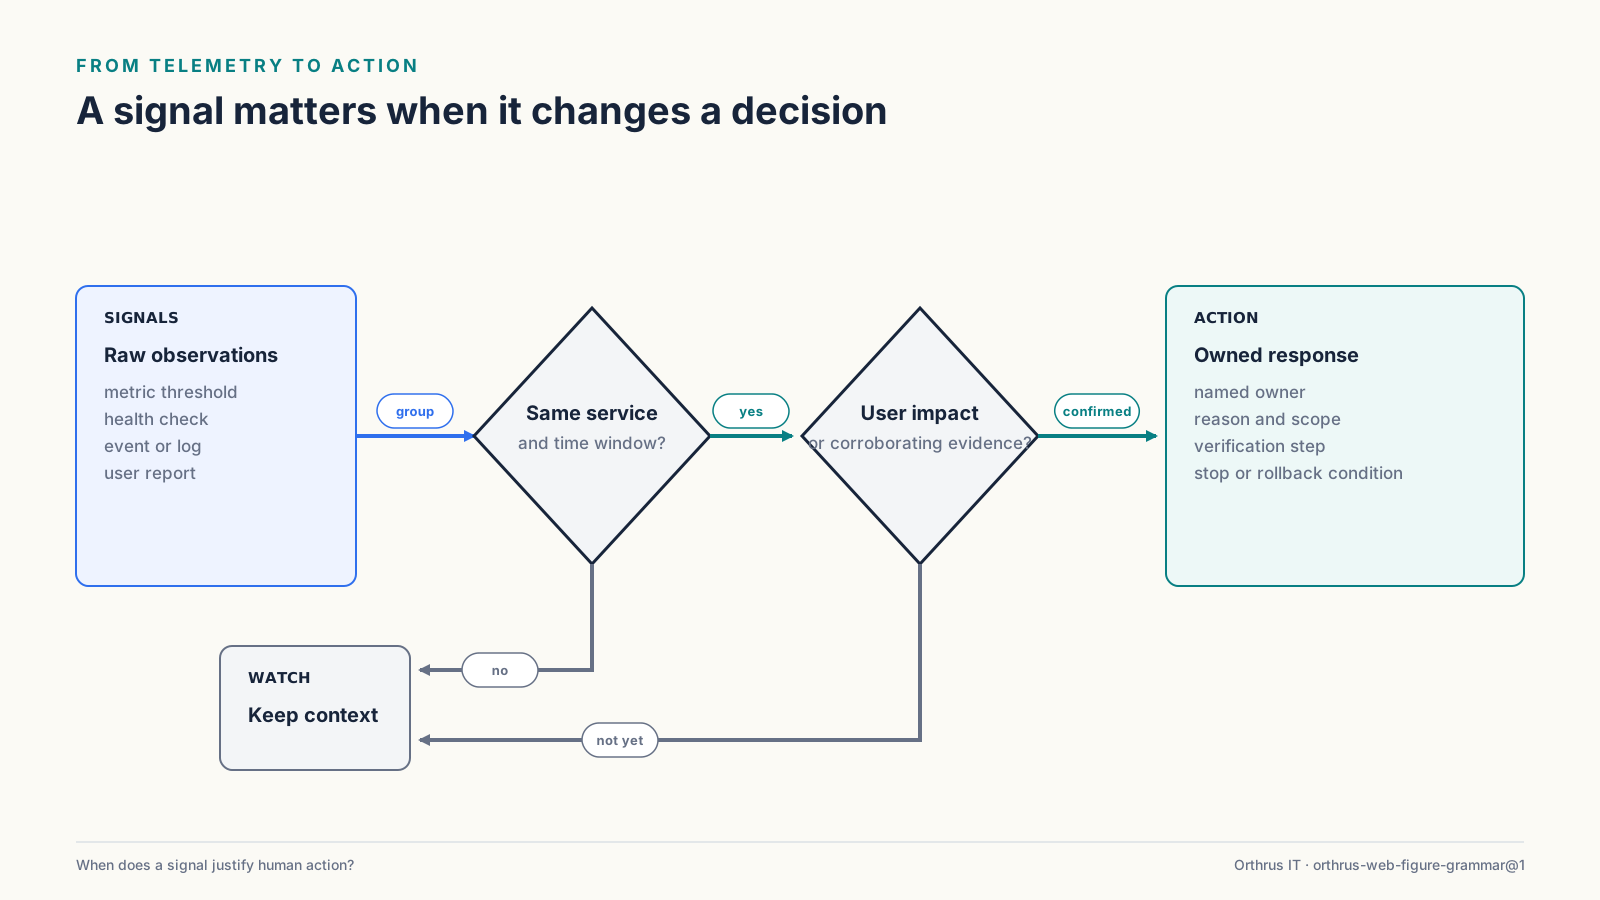
Repeated restarts, sustained resource pressure, failed backups, lost health checks and a meaningful rise in application errors deserve attention. A brief spike can remain visible on a dashboard without waking anyone.
Thresholds change after real incidents. If an alert never helps a decision, it is adjusted or removed. A smaller signal set is easier to trust when something genuinely goes wrong.
Use the same evidence for releases and incidents
After a UAT deployment, the release check reads workload state, public health, application errors and resource behaviour together. During an incident, the same trail narrows the problem from user impact to routing, workload or dependency.
Using one evidence path for both jobs has a practical payoff: diagnosis gets shorter, release decisions get better, and the post-incident note starts with facts rather than reconstruction.