What watches the platform: Prometheus, Loki and Grafana
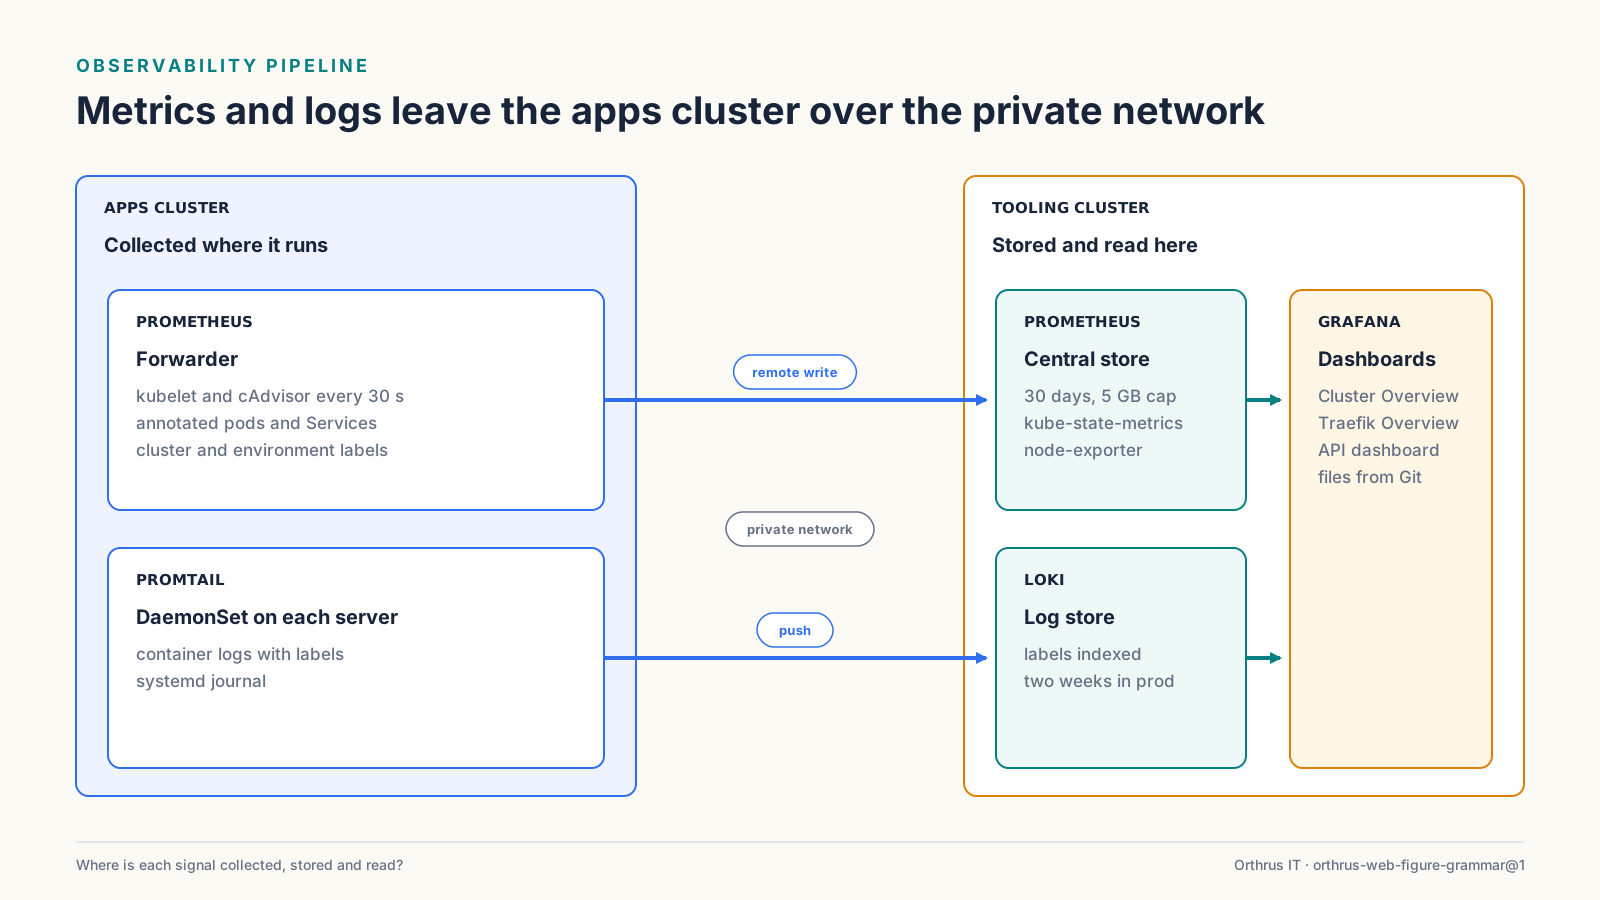
How metrics and logs travel from the application clusters to the tooling clusters, what the Grafana dashboards show, and how backup freshness gets checked twice a day.
Field notes
Technical decisions, implementation notes and lessons worth keeping. Topics can overlap because real systems rarely stay inside one category.
RSS feedHow metrics and logs travel from the application clusters to the tooling clusters, what the Grafana dashboards show, and how backup freshness gets checked twice a day.
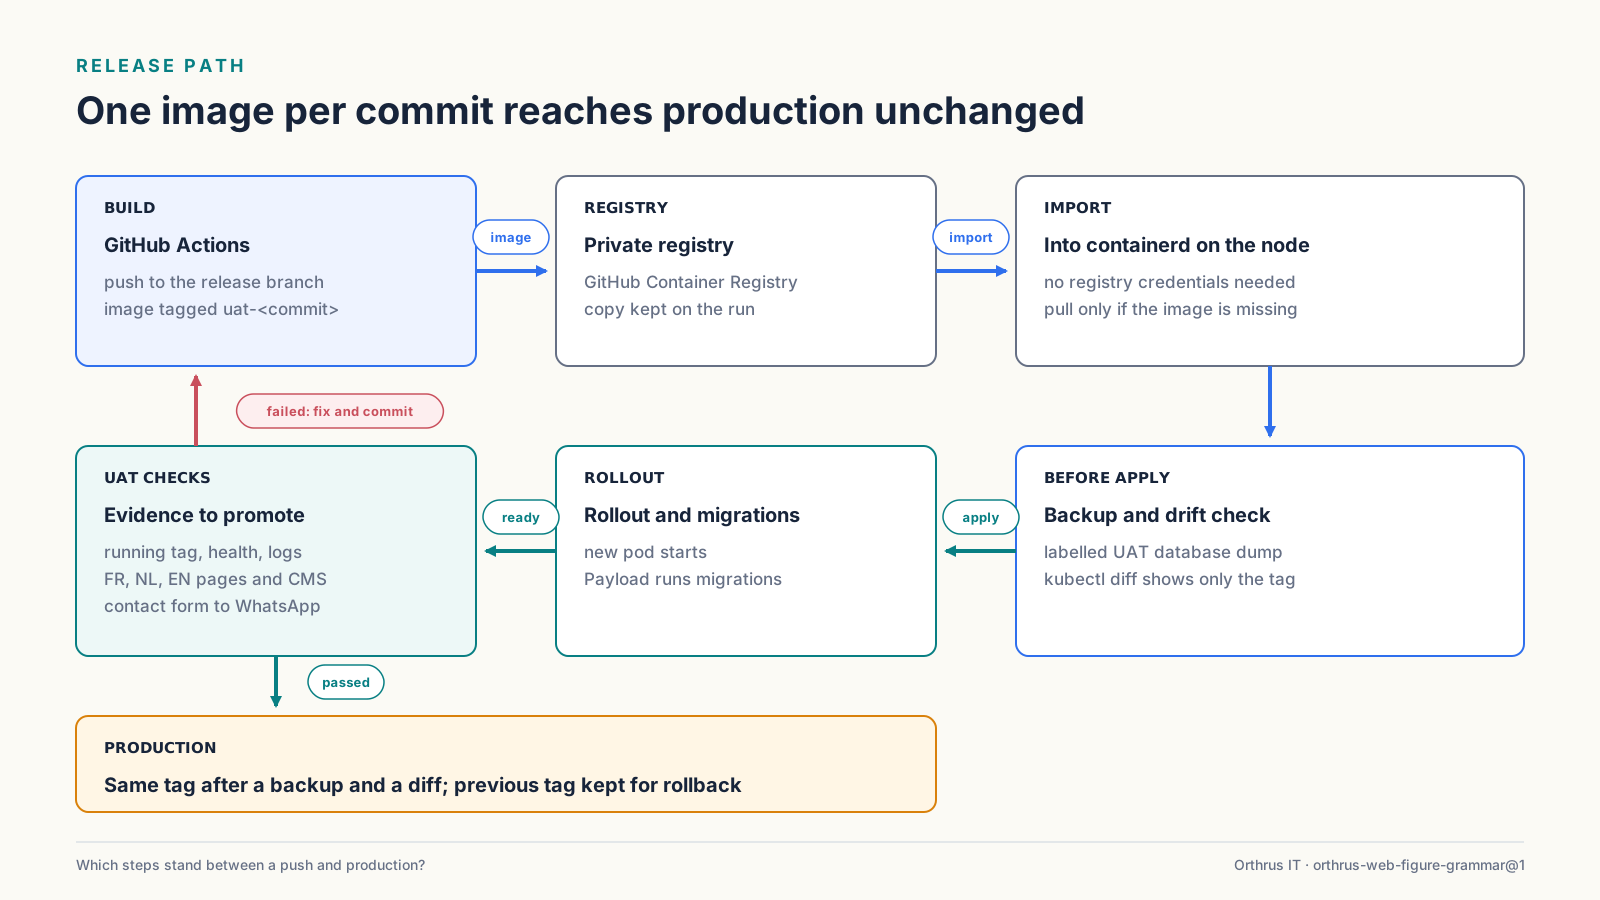
The release path of this site: an image built once per commit, tested in UAT against the live cluster state, then promoted to production without a rebuild.
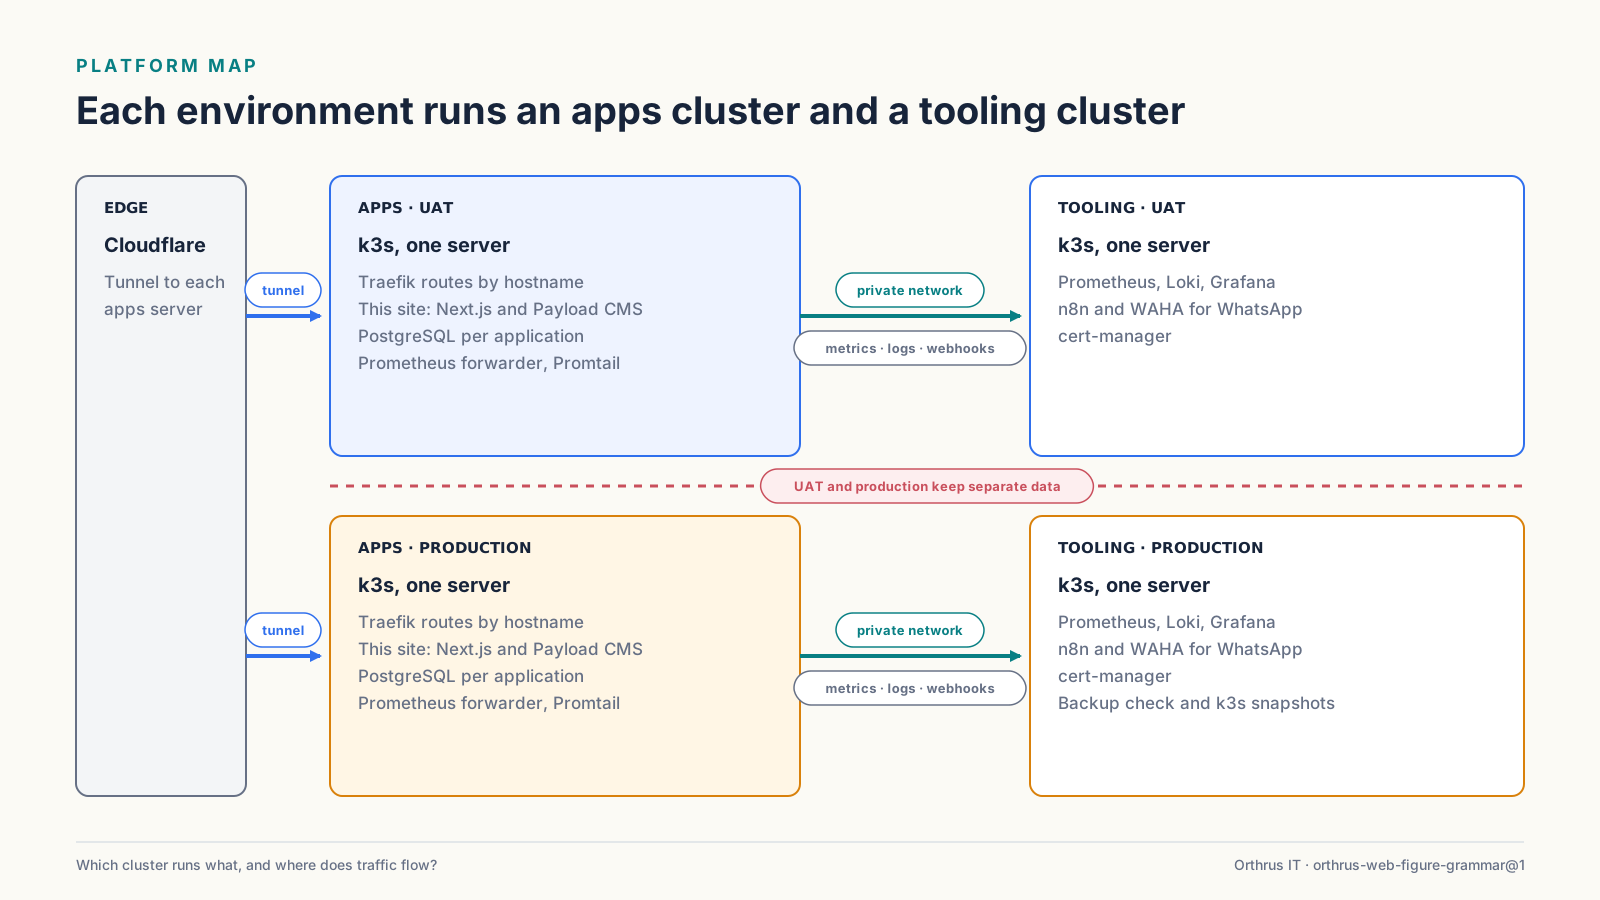
A working map of the platform behind this site: four single-node k3s clusters, how requests reach them, how their configuration lives in Git and where the backups go.